Multivariate Data Analysis
XLSTAT v.2022.4.5
XLSTAT is a complete data analysis and statistics add-in for Excel. It includes regression (linear, logistic, nonlinear), multivariate data analysis, parametric tests, non parametric tests, ANOVA, ANCOVA, forecasting methods.

Visual Stats v.2.0
Data analysis and multivariate statistical analysis: Probability analysis, descriptive statistics, frequency analysis, variance analysis, regression, .
StatistiXL v.1 8
statistiXL is a powerful data analysis package that runs as an add-in to Windows versions of Microsoft Excel.
MVSP v.3 2
MVSP is an inexpensive and easy to use program that performs a number of multivariate numerical analysis useful in many scientific fields.
QDA Miner v.4.0
The Mixed Method Solution for Qualitative Analysis. QDA Miner is an easy to use qualitative data analysis program package for coding textual and graphical data, annotating, retrieving and reviewing coded data, documents and images.
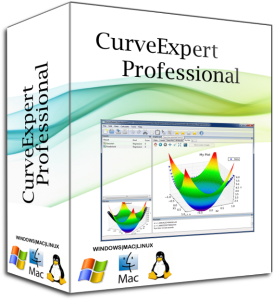
CurveExpert Professional for Mac OS X v.1.0.2
CurveExpert Professional is a cross-platform solution for curve fitting and data analysis.

CurveExpert Professional for Linux v.1.0.2
CurveExpert Professional is a cross-platform solution for curve fitting and data analysis.
Tools for Excel Tables
Essential tools for data analysis and tables management for novice and advanced Excel's users. A set of tools that will strengthen your Microsoft Excel to manage data bases and huge tables in your spreadsheets. Tools for Excel Tables is an addin
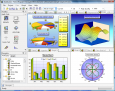
DataScene Lite
DataScene Lite is a data graphing and data analysis software package. It allows the user to easily plot brilliant 2D & 3D graphs (Area, Bar, Pie, Line, Surface, Polar, etc) with scientific, financial, and statistical data, to manipulate, print, and export
SimplexNumerica v.13.0.14.1
2D/3D technical graphics plotting and data analysis software for your plotting needs. Curve fitting, FFT and a presentation software! Download a demo of our analysis and plotting software!
QtiPlot v.0.9.8.6
QtiPlot is a program for two- and three-dimensional graphical presentation of data sets and for data analysis. Plots can be produced from data sets stored in tables or from analytical functions.
PSI-Plot v.9.01.0009
PSI-Plot brings flexibility to technical plotting and data analysis. It has a powerful scientific spreadsheet for data analysis, and an object-oriented on screen graphics editor that makes it easy to design and modify graphs.